The average fleet wastes 5–10% of its annual budget on underutilized assets and poor PM compliance — and most fleet managers can't even see it happening. Unplanned downtime alone costs $448–$760 per vehicle per day. Yet 53% of fleets are now researching or piloting AI analytics, because the gap between fleets that see their data in real time and fleets that wait for last month's spreadsheet is widening every quarter. Analytics-driven fleets achieve 3.5× ROI within 12 months, 27% TCO reduction, and 30% fewer unplanned breakdowns. The math is no longer up for debate.
Fleet analytics isn't about more data — it's about the right data, organized by priority, updated continuously, and connected across cost, safety, maintenance, and compliance. Modern dashboards layer 3–4 "north star" KPIs at the top with diagnostic drill-downs underneath, so a fleet manager goes from "log in" to "I know exactly which three vehicles need my attention this morning" in under 10 seconds. The fleets winning in 2026 aren't working harder — they're seeing faster.
This guide explains the four KPI categories every fleet should track, the north-star metrics that drive decisions, dashboard architecture that prevents fatigue, and how to use analytics to spot waste before it shows up on your P&L. Start your free trial to build your first fleet KPI dashboard within an hour.
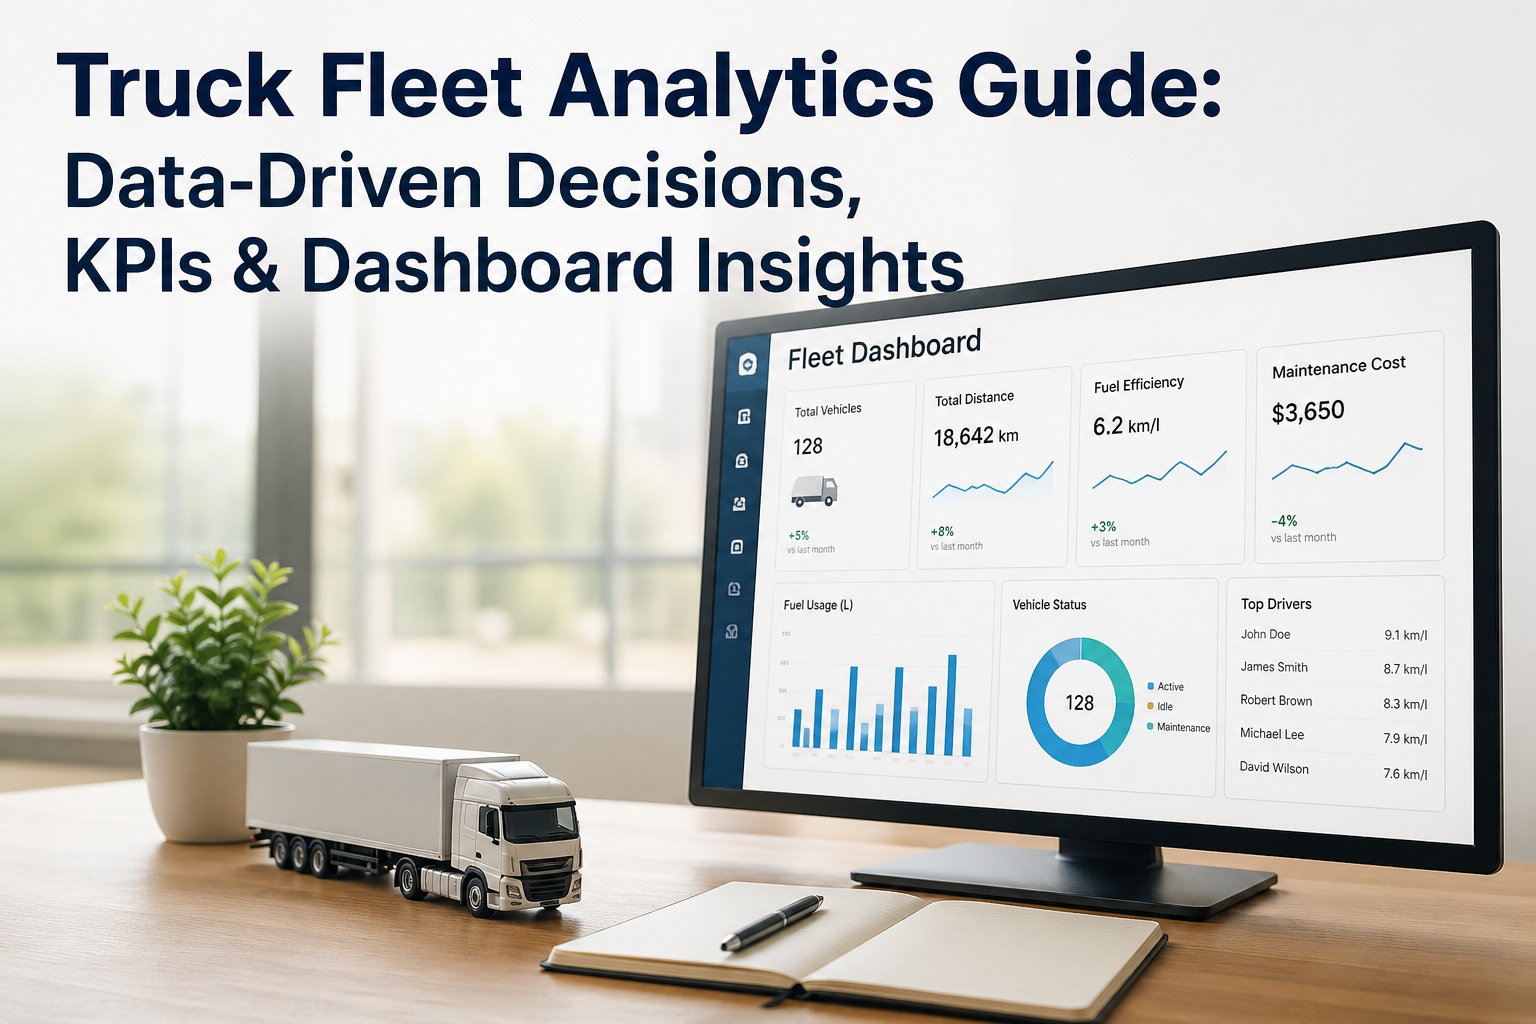
Truck Fleet Analytics Guide: Data-Driven Decisions, KPIs & Dashboard Insights
Stop drowning in data. Build a dashboard around the 4 KPIs that actually drive decisions, and turn raw fleet data into measurable cost savings — 3.5× ROI within 12 months.
Quick Answer: What Is Fleet Analytics?
Fleet analytics is the process of collecting, analyzing, and visualizing operational data across your truck fleet — including telematics, maintenance records, fuel logs, driver behavior, and compliance data — to drive faster, more accurate operating decisions. Modern fleet analytics platforms combine real-time data feeds with KPI dashboards, automated alerts, predictive maintenance models, and exception reporting, replacing the lag of monthly spreadsheets with continuous insight. The shift from reporting (what happened) to analytics (what's happening, what's likely next, and what to do about it) is the defining technology trend in fleet management for 2026.
The 4 KPI Categories Every Fleet Must Track
A balanced fleet dashboard pulls from all four KPI categories — not 80% cost metrics with nothing on safety or compliance. Tracking from only one or two pillars creates blind spots that quietly destroy ROI. Contact our support team to map your existing data streams to the four-pillar framework.
The 4 North-Star KPIs Most Worth Tracking
If you can only watch four numbers in real time, these are the ones. The 2026 industry consensus across Fleetio, Verizon Connect, Geotab, and Utilimarc benchmarks: these four metrics give you a complete fleet health check at a glance — every other KPI is a drill-down off these.
Dashboard Architecture: How To Avoid "Dashboard Fatigue"
A dashboard with 40 metrics shown at equal visual weight is a dashboard nobody looks at. The 2026 industry best practice is a tiered hierarchy — north stars at the top, supporting metrics in a band below, drill-downs one click away. Sign up free for 3 trucks to see this hierarchy applied to your fleet data.
Reactive Spreadsheet vs Analytics-Driven Fleet
The performance gap between fleets running on monthly spreadsheets and fleets running real-time analytics is staggering. Here's the 12-month side-by-side for a typical 50-vehicle fleet — the same trucks, same drivers, same routes, dramatically different outcomes.
The 5-Step Analytics Workflow
A fleet dashboard isn't a decoration — it's a decision engine. The metrics only matter if they trigger action. Here's the operational rhythm successful fleets follow to convert data into measurable outcomes. Talk to our support team to align this workflow with your team's existing processes.
Frequently Asked Questions
2026 best practice: 3–4 north-star KPIs at the top (cost per mile, vehicle utilization, unplanned downtime, PM compliance), with 4–6 supporting metrics in a secondary band. All remaining KPIs should be one-click drill-downs, not dumped onto the main view. Tracking 40 metrics with equal visual weight creates dashboard fatigue and managers stop looking entirely. Sign up free to see the tiered hierarchy applied to your data.
Fleet tracking shows where vehicles are in real time — it answers "where are my trucks?" Fleet analytics layers KPIs, dashboards, predictive insights, and exception reporting on top of tracking data — it answers "how is my fleet performing and where should I focus today?" Tracking is one data input; analytics is the decision layer that connects tracking, maintenance, fuel, driver, and compliance data into actionable insight.
Most fleets see meaningful ROI within 60–90 days. Quick wins (idle reduction, missed PM catch-up, route waste) appear in week one. Predictive maintenance benefits show up around 30–60 days as the AI models build pattern recognition on your specific fleet. Documented industry benchmark: 3.5× ROI within 12 months, 27% TCO reduction.
Small fleets often gain MORE proportionally because every wasted dollar matters more. Modern cloud platforms scale down to 5–10 vehicles cost-effectively. The unit economics work: a single emergency repair avoided typically pays for a full year of analytics software for a small fleet. Contact our support team to see analytics scaled to your fleet size.
The shift is from "reporting" to "real-time decisioning." AI now surfaces maintenance risks 20–45 days before traditional diagnostics, route optimization AI delivers 10–15% fuel savings, and generative AI dashboards accept queries like "Why did fuel costs spike last Tuesday?" Roughly 53% of fleets are now researching or piloting AI analytics — the technology has crossed from experimental to operational.
Yes — modern fleet analytics platforms integrate with 40+ telematics providers including Samsara, Verizon Connect, Geotab, Fleet Complete, and Teletrac Navman via direct API. The biggest analytics gains come when telematics data flows into the same system as your maintenance, DVIR, and fuel records — eliminating data silos. Start your free trial to connect your existing telematics in minutes.
Build a Fleet Dashboard That Actually Drives Decisions
Real-time KPIs across financial, operational, safety, and compliance pillars — all connected to your maintenance, DVIR, and telematics data. See how 500+ fleets cut costs, prevent breakdowns, and prove ROI to leadership.