More than half of a Class 8 truck's highway fuel burns just pushing air out of the way. At 65 MPH, aerodynamic drag consumes over 50% of total engine output — which means every square inch of turbulent airflow translates directly into diesel dollars vanishing at the pump. The physics are simple: drag rises with the square of velocity, so a truck at 75 MPH burns roughly 27% more fuel than the same truck at 65 MPH. The math is brutal, the fix is knowable, and most fleets leave thousands of dollars per truck per year on the table.
Aerodynamic truck design has matured from wind-tunnel theory into a practical toolkit that every fleet can deploy. Gap fairings, side skirts, boat tails, roof deflectors, wheel covers, and full trailer integration packages each chip away at drag — and combined, they deliver 14–25% fuel savings on long-haul routes. For a fleet spending $1M annually on fuel, that's up to $250,000 straight back to the bottom line.
This guide breaks down the physics of truck aerodynamics, maps the fuel-saving components on a modern tractor-trailer, compares real-world device costs and payback, and shows how to prioritize upgrades for maximum ROI. Start your free trial to track fuel efficiency gains across your fleet in one platform.
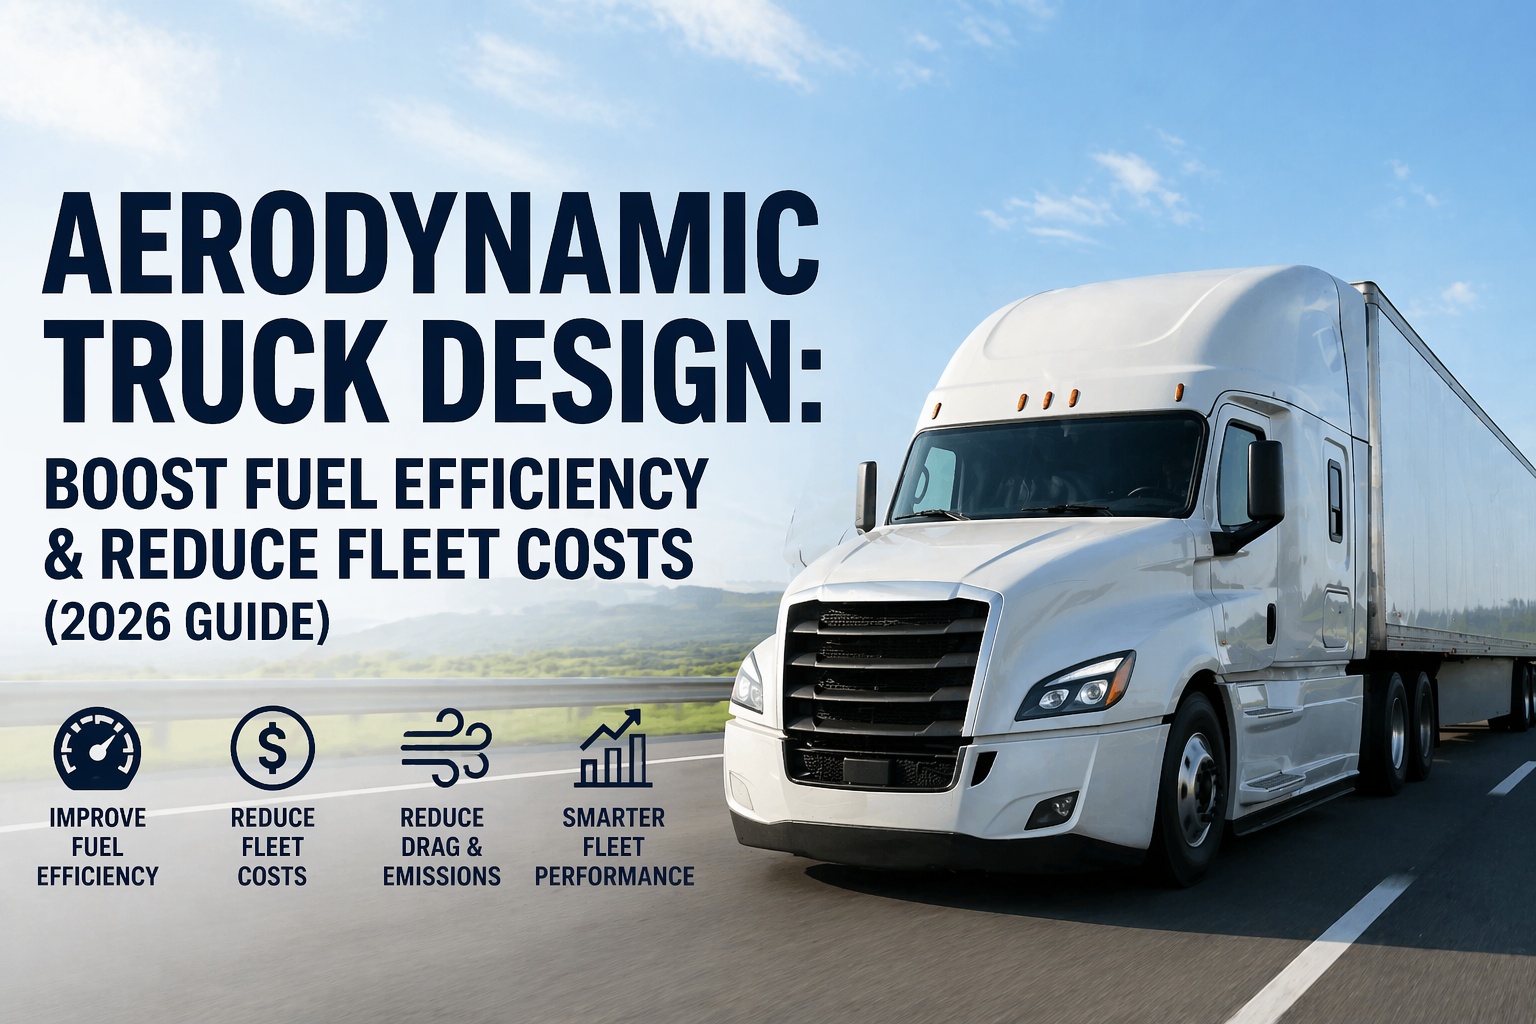
Aerodynamic Truck Design: Boost Fuel Efficiency & Reduce Fleet Costs (2026 Guide)
Over 50% of highway fuel fights aerodynamic drag. Cut that drag with the right design choices — and see fuel savings of 14–25% compound across every mile of every truck in your fleet.
The Physics: Why Aerodynamics Decides Your Fuel Bill
Understanding truck aerodynamics starts with one non-negotiable rule: drag force rises with the square of velocity. Double the speed, and the engine has to work four times harder to punch through the air. At highway speeds, this overshadows almost every other fuel variable. Contact our support team to benchmark your current fleet's MPG against aero-optimized targets.
Anatomy of an Aerodynamic Truck
Every external surface of a tractor-trailer either smooths airflow or disrupts it. This diagram breaks down the critical aero zones — where the drag is created, what fixes it, and the typical fuel savings each component delivers when properly specified.
Real Fuel Savings by Upgrade Package
These numbers are pulled from SmartWay-verified testing, SuperTruck program data, and fleet case studies. The savings assume typical long-haul operation at 65 MPH with loaded trailers. Urban and short-haul fleets see roughly half the benefit since drag contributes less at lower speeds.
| Upgrade Package | Fuel Savings | Typical Cost/Truck | Annual Savings* | Payback |
|---|---|---|---|---|
| Gap Fairing Only | 2–3% | $500–$1,500 | $400–$600 | 18–24 mo |
| Side Skirts Only | 4–7% | $1,800–$3,500 | $900–$1,400 | 18–24 mo |
| Boat Tail / Trailer Tail | 5–6% | $2,000–$4,000 | $1,200–$1,500 | 20–30 mo |
| Wheel Covers & Hub Caps | 1–2% | $400–$800 | $300–$450 | 12–24 mo |
| Combined Trailer Package | 10–14% | $4,500–$8,000 | $2,500–$3,200 | 18–30 mo |
| + Low-Rolling-Resistance Tires | 13–17% | $6,500–$10,500 | $3,100–$3,900 | 24–30 mo |
| Full Aero + ATIS + LRR Tires | 18–25% | $9,000–$14,000 | $4,500–$5,800 | 24–36 mo |
| OEM Aero-Optimized Spec (new truck) | 20–30% | Spec at purchase | $5,000–$7,500 | Lifecycle |
Track Fuel Efficiency Gains Across Your Fleet
Monitor MPG by truck, correlate with aero upgrades and maintenance, and prove ROI to leadership — all inside the Truck Inspection & Maintenance platform.
Technology Catalog: 6 Aero Upgrades Ranked
Not every upgrade fits every fleet. Urban delivery, refrigerated, tanker, and flatbed operations each have different constraints. Here are the six most deployed aero technologies, with the practical tradeoffs each one carries. Sign up free for 3 trucks to log which upgrades go on which assets.
Quick Wins vs Long-Term Investments
A smart aero strategy blends immediate zero-cost wins with mid-term retrofits and long-term OEM specs. Not every fleet can afford to re-spec every trailer tomorrow — but every fleet can check fairings today. Talk to our support team to build a phased upgrade plan for your fleet.
Frequently Asked Questions
On long-haul routes, yes — typically within 18–30 months for most retrofit packages. A full aero package costing $9,000–$14,000 per truck saves $4,500–$5,800 annually for a fleet running 120,000 miles/year at current diesel prices. Short-haul and urban delivery see roughly half the benefit, so payback stretches to 36+ months. Sign up free to model the payback math across your specific fleet.
Trailer side skirts for any long-haul fleet. They deliver 4–7% fuel savings for $1,800–$3,500 per trailer, with 18–24 month payback and minimal maintenance impact. SmartWay-verified options qualify for fuel economy programs, and multi-unit bulk pricing drops costs another 10–15%. Pair them with cab extender inspections (usually free) for even bigger gains.
Partially. Aerodynamic drag accounts for about 25% of short-haul fuel consumption vs 50%+ for long-haul highway operation. That means a device delivering 5% savings on a highway truck gives roughly 2–2.5% on a city delivery vehicle. The math still works for fleets running 50,000+ miles/year, but the ROI timeline roughly doubles.
Dramatically. Because drag rises with the square of velocity, every 1 MPH over 65 MPH costs roughly 0.14 MPG. A truck running 75 MPH burns about 27% more fuel than the same truck at 65 MPH on the same route. The ATA estimates capping industry-wide truck speeds at 65 MPH would save $2.8 billion over 10 years. Contact our support team to see how speed data from your telematics correlates with MPG per truck.
For trailers and retrofit packages, yes — many aftermarket kits match or exceed OEM performance, especially for side skirts and boat tails. For tractor cabs, OEM aero-optimized designs (Cascadia Evolution, Volvo VNL series) still win because aerodynamics are engineered into the body itself rather than bolted on. The best approach: spec aero-optimized tractors at purchase, then retrofit trailers with proven aftermarket gear.
Significantly. Bent cab extenders, missing side skirt panels, damaged roof fairings, and misaligned fifth wheels all degrade aerodynamics by measurable percentages. Daily walk-arounds should check aero components — a damaged fairing ignored for three months can erase an entire year's worth of fuel savings. Sign up free to add aero-component checks to your digital DVIR workflow.
Turn Aero Upgrades Into Measurable Fleet Savings
Track MPG by truck, correlate improvements with aero retrofits, and prove fuel ROI to leadership — all inside the Truck Inspection & Maintenance platform. See how 500+ fleets turn design decisions into bottom-line results.