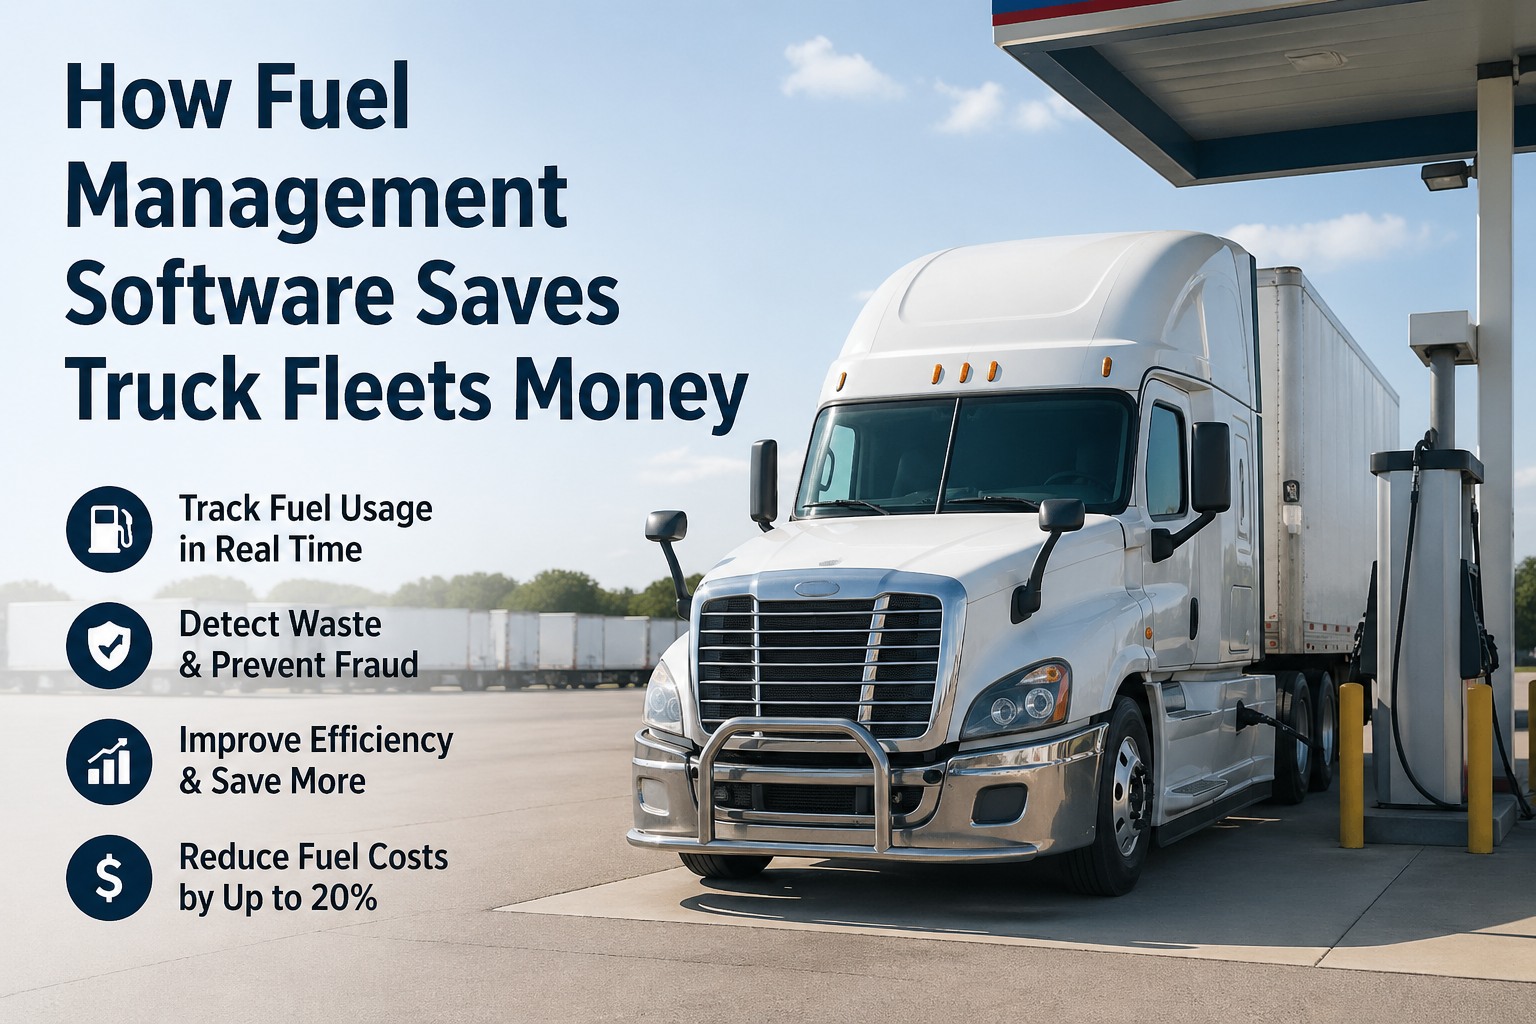
Here's the question that determines whether your fleet makes money or bleeds it: when a $200 oil change prevents a $20,000 engine rebuild, why are 70% of fleet managers still operating reactively? The math isn't subtle — every $1 invested in preventive maintenance saves $3-9 in reactive repair costs, with some fleets reporting up to 545% ROI on their PM programs. Yet most fleets still treat maintenance as a budget line to minimize instead of an investment to maximize. This article puts both approaches head-to-head with real 2026 data — actual dollar figures, downtime costs, and ROI numbers from the ATRI fleet benchmarks. Talk to our team to see exactly where your fleet falls on this spectrum.
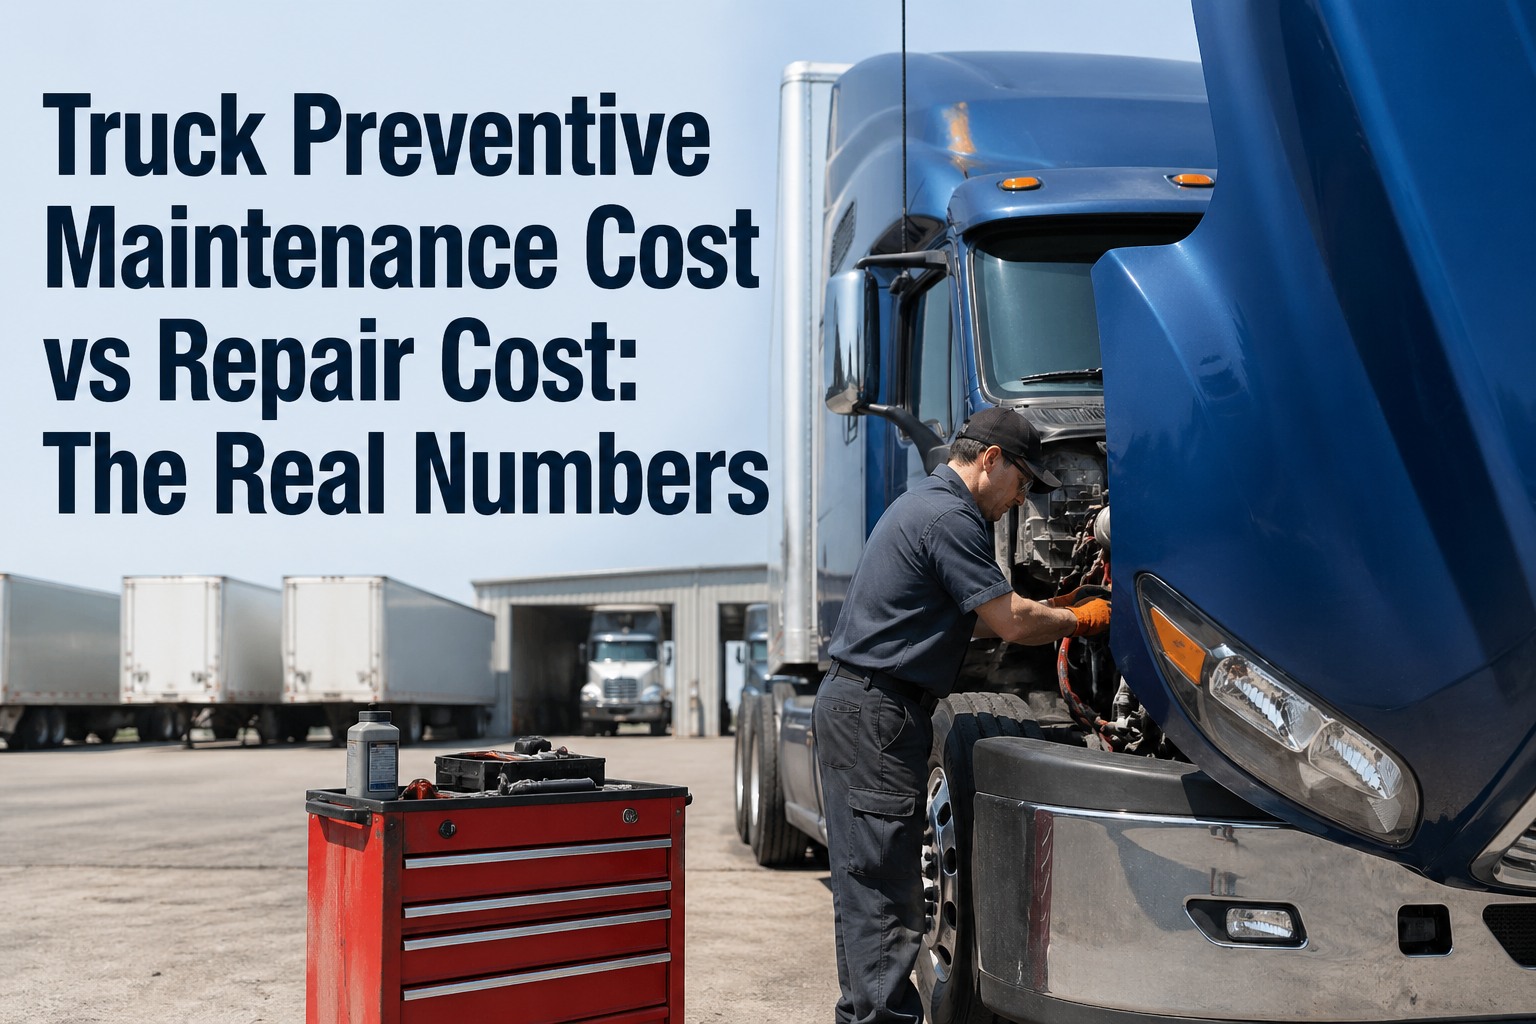
PM Cost vs Repair Cost: The Real Numbers
A data-driven head-to-head — and why 70% of fleets are losing the math.
The Side-by-Side Cost Showdown
Same component. Same vehicle. Two completely different cost outcomes depending on whether you caught the issue early or waited for failure. Here's what the data shows for the most common fleet failure points:
Sources: ATRI 2025 Operational Costs of Trucking, Fleet Owner repair benchmark data. Figures exclude downtime, towing, and revenue loss — which often double the reactive total.
The Hidden Cost Iceberg
Direct repair costs are just the visible 60-70% of the iceberg. The remaining 30-40% — the part that sinks fleet budgets — sits below the waterline. Here's what most fleet managers miss when comparing PM cost to repair cost:
The ROI Multiplier — How $1 Becomes $9
The 3-9x return on PM spend isn't a marketing number — it's a calculated cascade. Each dollar prevents specific downstream costs that compound across the fleet. Here's the math broken down:
Fleet Maturity vs Cost Curve
Where your fleet sits on the PM-to-reactive ratio determines exactly how much money is leaking. Best-in-class fleets allocate 80-85% of maintenance budget to planned work. Average fleets hover around 60% planned. The gap is worth thousands per truck per year:
Industry data: Best-in-class fleets spend 25-35% less than reactive operations on the same vehicle types — through PM compliance, not capital investment.
Find out where YOUR fleet sits on this curve
Truck Inspection & Maintenance imports your fleet data and instantly calculates your reactive-to-planned ratio, current cost per mile, and the dollar amount you're leaving on the table. No credit card. No hardware. 10-minute setup.
Real Fleet Case Studies — The Shift in Action
Numbers in spreadsheets are abstract. These are documented results from fleets that moved from reactive to proactive maintenance:
Mid-size carrier, 1,500 PMs/year. Implemented structured PM scheduling. Asset utilization rose to 99% — the highest the fleet had ever recorded. Annual savings: estimated $2.3M across the fleet.
50-truck regional logistics fleet. Reduced cost per mile by 42% over 18 months by shifting reactive work below 25% of total maintenance spend. Total annual savings: $390,000.
Heavy-duty fleet, 80 trucks. Predictive maintenance caught a recurring failure mode across the fleet before any roadside breakdown — preventing $12,500 average repair cost per vehicle. Total saved: $1M in 4 months.
The Break-Even Math by Fleet Size
How long does it take Truck Inspection & Maintenance to pay for itself? For most fleets, the first prevented breakdown covers a year of platform cost. Here's the precise break-even by fleet size:
Calculation basis: Software at $3/vehicle/month, savings at $15K-$25K per truck (industry benchmark for fleets shifting reactive to proactive). Break-even calculated against software cost only — first prevented breakdown typically delivers full payback within 30-45 days.
What Drives the Cost Gap
The cost difference between PM and reactive isn't just the parts and labor — it's six compounding factors that stack against any fleet without a structured program:
Emergency Premium
Roadside repairs cost 150-200% more than shop labor. Emergency parts ship at 3-5x standard pricing. The clock is your enemy.
Cascading Failures
One ignored issue triggers others. A worn brake destroys a rotor. A late oil change scores a cylinder. Reactive repairs rarely stop at one component.
Lost Revenue
Daily downtime costs $448-$760 per truck. A 3-day breakdown wipes out months of PM savings on that vehicle alone.
Compliance Exposure
FMCSA violations average $7,155 each. Poor maintenance records destroy CSA scores, raising insurance premiums for years.
Resale Damage
Documented PM history commands 5-15% resale premium. Reactive-only fleets sell trucks at the bottom of the market every time.
Driver Turnover
Drivers stranded by breakdowns leave. Replacement costs $7K-$10K per driver. Reliable trucks retain reliable drivers.
Frequently Asked Questions
How much does preventive maintenance actually cost vs reactive repair?
Industry data shows preventive maintenance costs $0.12-$0.18 per mile for best-in-class fleets, while reactive operations spend $0.22-$0.30 per mile. On a per-event basis, reactive repairs cost 3-9x more than equivalent planned maintenance — a planned engine oil analysis runs $800-$1,500, while a reactive engine failure costs $15,000-$35,000. Contact our support team to calculate your fleet's exact cost-per-mile breakdown.
What's the realistic ROI of a structured PM program?
Most fleets see 300-500% ROI in year one, with peak performers reaching 545%. Average savings hit $15,000-$25,000 per truck annually for fleets shifting from 60% planned to 80%+ planned maintenance. The first prevented breakdown typically pays for the entire annual cost of PM software — usually within 30-45 days of implementation.
Why do reactive repairs cost 3-9x more than preventive maintenance?
Six compounding factors: emergency labor premiums (150-200%), rush parts shipping (3-5x markup), cascading damage to adjacent components, daily downtime cost of $448-$760 per truck, FMCSA compliance exposure averaging $7,155 per violation, and resale value damage of 5-15%. Direct repair cost alone is only 60-70% of true reactive expense.
What percentage of my maintenance budget should go to PM vs reactive?
Best-in-class fleets allocate 80-85% to planned maintenance and 15-20% to reactive repairs. Average fleets sit at 60% planned, 40% reactive. World-class operations spend 25-35% less than reactive fleets on the same vehicle types — purely through PM compliance, not capital investment. Sign up free to assess your current ratio in under 10 minutes.
How quickly will I see savings after switching to a PM-first approach?
Measurable savings appear within 30-60 days. The first prevented breakdown delivers immediate ROI. By month 3, fuel costs drop 5-10% from optimized maintenance. By month 6, compounding returns from extended vehicle life and improved compliance become substantial. By year-end, fleets typically report $15,000-$25,000 saved per truck.
Is the cost gap the same for diesel, hybrid, and EV trucks?
The percentage gap is similar across powertrains, but the dollar amounts differ. EVs save 25-40% on scheduled maintenance vs diesel — no oil changes, no DPF service, no transmission service. However, EV reactive repairs (battery thermal failures, inverter damage) can exceed $20,000, meaning the cost-of-skipping-PM math is just as severe. Contact our EV specialists to discuss diesel-vs-EV cost tracking for mixed fleets.
Stop paying the reactive premium.
Every month without structured PM costs the average 50-truck fleet $14,500-$22,900 in preventable expense. Truck Inspection & Maintenance loads PM-A through PM-D templates in under 10 minutes, automates multi-trigger scheduling, and delivers DOT-compliant records. Free for up to 3 vehicles. Your first prevented breakdown pays for an entire year.